Introduction
A Leveraged Buyout (LBO) is a strategic financial transaction in which a company is acquired predominantly through borrowed funds, using the assets of the acquired company as collateral for the debt. This paper provides a detailed hypothetical case study of an LBO involving the acquisition of AlphaCore Technologies Inc., a leading technology solutions provider. The case study will elucidate the crucial steps, financial projections, and strategic considerations necessary for successfully executing an LBO.
LBO Details -AlphaCore Technologies Inc
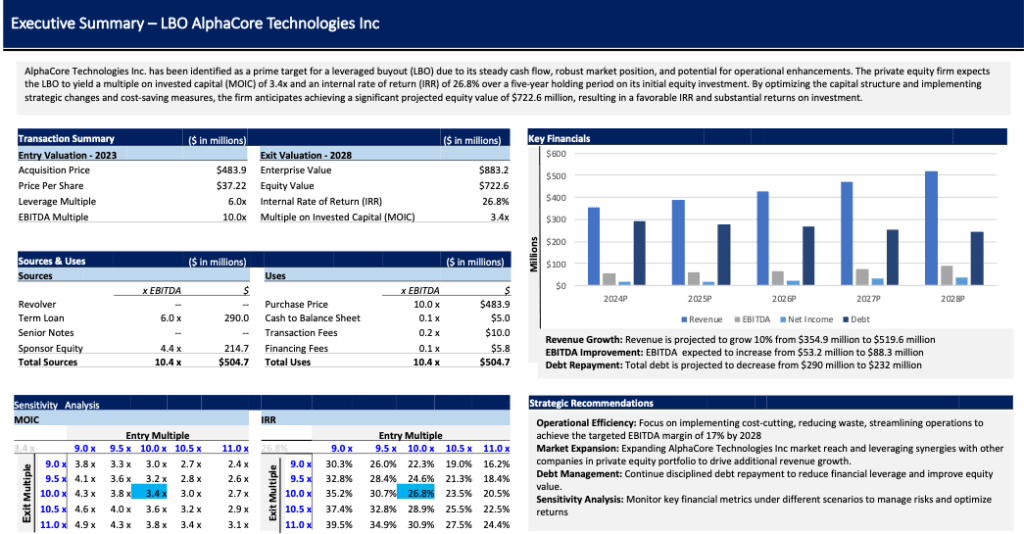
The first step in a Leveraged Buyout (LBO) is to identify a suitable target company. A private equity firm is considering the leveraged buyout of AlphaCore Technologies Inc., a privately-owned technology solutions provider. AlphaCore Technologies Inc. is chosen due to its steady cash flow, strong market position, and potential for operational improvements.
AlphaCore Technologies Inc current share price is $30.0 and outstanding share is 13 million. In the last twelve months (LTM), AlphaCore Technologies Inc. generated $322 million in revenue and $48.4 million in EBITDA. If acquired, the PE firm believes AlphaCore Technologies Inc.’s revenue can continue to grow 10% year-over-year while its EBITDA margin remains constant for first 3 year then increase to 16% in year 4 and 17% in year 5, indicating that it is a financially stable and profitable company, making it an attractive candidate for an LBO.
If the PE firm were to purchase AlphaCore Technologies Inc. at 10.0x LTM EV/EBITDA on 12/31/2023 and then exit at the same LTM multiple after a five-year time horizon, with a minimum required return of 20%, several financial and strategic considerations need to be made. Entry leveraged ratio is 6.0x.
To fund this transaction, the PE firm was able to obtain Term Loan financing, which comes with a seven-year maturity, 4% mandatory amortization, and is priced at a 7.5% rate. The financing fees were 2% for each tranche, while the total transaction fees incurred were $10 million.
On AlphaCore Technologies Inc.’s balance sheet, there is $100 million of existing debt and $10 million in cash. The business will be delivered to the buyer on a “cash-free, debt-free basis,” meaning the seller is responsible for extinguishing the debt and keeps all the excess cash. AlphaCore Technologies Inc. needs $5 million in cash-on-hand to continue operating and meet its short-term working capital obligations.
Assume for each year that AlphaCore Technologies Inc.’s depreciation & amortization expense (D&A) will be 3% of revenue, capital expenditures (Capex) requirement will be 3% of revenue, the change in net working capital (NWC) will be 1% of revenue, and the tax rate will be 29%
Executive Summary
LBO Model
LBO Modeling is a method to measure the implied returns on a leveraged buyout transaction (LBO), which is a specialized type of acquisition where a substantial percentage of the purchase price is funded using debt.

Step 1. LBO Entry Valuation & Key Assumptions
The first step in building an LBO model is to calculate the implied entry valuation based on AlphaCore Technologies Inc.
Deal is structured as a cash-free, debt-free transaction (CFDF), the sponsor is not assuming any of AlphaCore Technologies Inc.’s debt or receiving any of its excess cash.
A Cash-Free, Debt-Free (CFDF) transaction structure means the buyer does not assume any debt on the seller’s balance sheet, nor do they get to keep any leftover cash. If a deal is structured as CFDF, the purchase price equates to the enterprise value (TEV) to the buyer.
- Entry Purchase Enterprise Value (TEV) = LTM EBITDA × Entry EBITDA Multiple
- LTM EBITDA: $48.4 million (15% EBITDA margin)
- Entry EBITDA Multiple: 10.0x
- Entry Purchase Enterprise Value (TEV) = $483.9MM
- Entry Assumptions:
- Entry EBITDA Multiple: 10x
- Entry Year: 2023
- Leverage Ratio: 6.0x
- Minimum Cash: $5 million
- Exit Assumptions:
- Exit EBITDA Multiple: 10.0x
- Exit Year: 2028 (5 years)
- Minimum Rate of Return: 20%
- LBO Transaction Assumptions:
- Transaction Fees: The transaction fees were $10 million – this is the fee paid to investment banks for M&A advisory, lawyers, accountants, and consultants who assisted with the deal. These advisory fees are treated as a one-time expense.
- Financing Fees: The 2% deferred financing fee refers to the costs incurred to raise debt capital to fund this transaction. This financing fee will be amortized over the term of the debt, which is seven years in this scenario.
- Cash to Balance Sheet (B/S): The minimum cash balance required at $5 million.
4. LBO Transaction Assumptions:
- LBO Transaction Assumptions:
- Transaction Fees: The transaction fees were $10 million – this is the fee paid to investment banks for M&A advisory, lawyers, accountants, and consultants who assisted with the deal. These advisory fees are treated as a one-time expense.
- Financing Fees: The 2% deferred financing fee refers to the costs incurred to raise debt capital to fund this transaction. This financing fee will be amortized over the term of the debt, which is seven years in this scenario.
- Cash to Balance Sheet (B/S): The minimum cash balance required at $5 million.
- Debt Assumptions:
- The initial leverage multiple used in this transaction was 6.0x.
- The amount of debt provided by the lender is expressed as a multiple of EBITDA (also called a “turn”). In this case, all debt is raised using a Term Loan priced at 7.5% (fixed rate) with a leverage multiple of 6.0x EBITDA.
- Term Loan: A Term Loan is provided by an institutional lender and is generally a lien loan with a 5 to 7-year maturity and low amortization requirements. The amount of TL raised was calculated by multiplying the 6.0x leverage multiple by the LTM EBITDA of $48.4 million thus, $290 million.
- Senior Notes: No senior note debt financing.

Step 2. Sources and Uses of Funds Table
The next step is to create the sources & uses schedule
1. Uses: The “Uses” side calculates the total amount of capital required to make the acquisition.
- Total Uses = Entry Purchase Enterprise Value (TEV) + Transaction Costs (M&A Advisory Fees, Legal Fees, and Consulting Fees) + Financing Fees (Debt Issuance Costs (Underwriting Fees)
- Entry Purchase Enterprise Value: $483.9 million is the total amount being offered by the private equity firm to acquire the equity of AlphaCore Technologies Inc.
- Cash to B/S: AlphaCore Technologies Inc.’s cash balance cannot dip below $5 million post-transaction. As a result, the “Cash to B/S” effectively increases the total funding required and thus is included on the “Uses” side of the table.
- Transaction Fees: $10 million
- Financing Fees: $5.8 million
The total capital required to complete this proposed acquisition of AlphaCore Technologies Inc. is $504.7 million.
2. Sources: The “Sources” side details how the deal will be funded, including the required amount of debt and equity financing.
- Total Sources = Debt Capital + Sponsor Equity
- Debt Financing = Leverage Multiple × LTM EBITDA
- Debt Financing = 6.0 x × $48.4 =$290 MM
Now that we have determined the total amount required and the amount of debt funding, the remaining funds needed will be provided by “Sponsor Equity.”
- Sponsor Equity = Total Uses – Debt Financing
- Sponsor Equity = $504.7 MM – $290 MM = $214.7 MM

Step 3. Financial Forecast and Debt Schedule
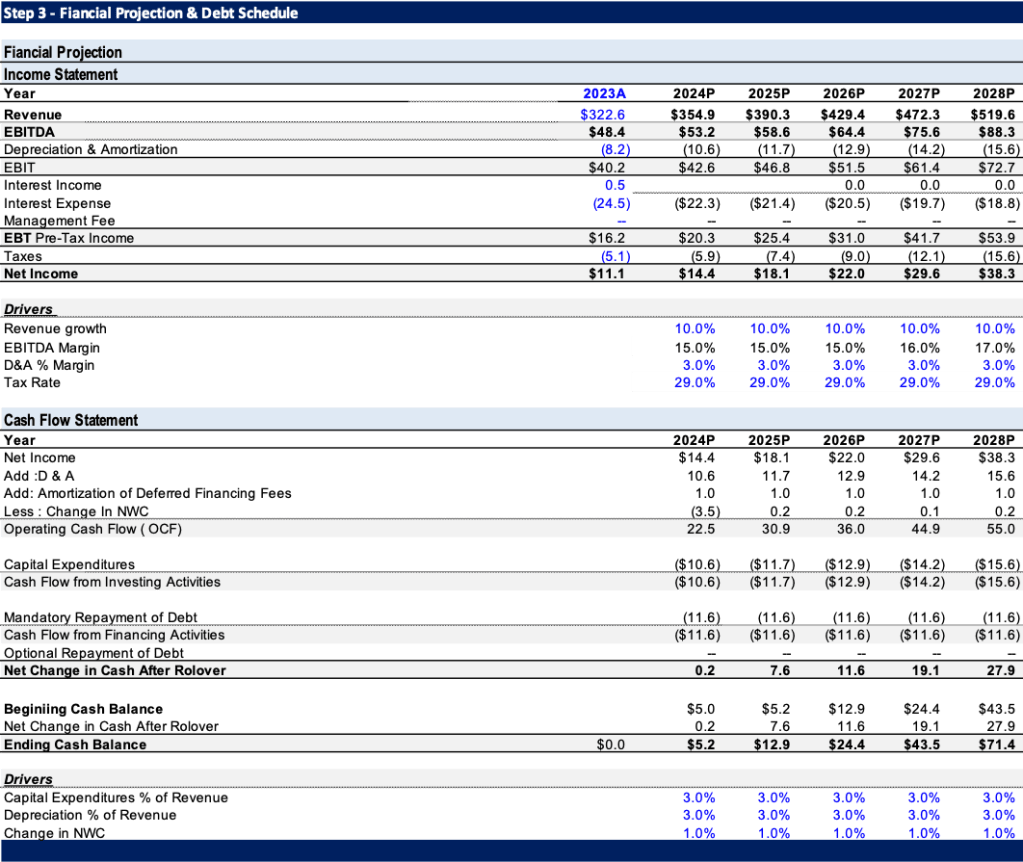
- Building the LBO model involves projecting the income statement, debt schedule, and cash flow statement over a 5-year period.
- Financial projections are crucial for assessing the company’s future financial performance, debt repayment capabilities, and overall profitability and feasibility of the LBO
- Operational Improvements:
- Implement cost-saving measures and focus on operational efficiency to improve EBITDA margin from 15% to 16% in year 4 and 17% in year 5.
- Expand market reach to drive revenue growth.
- Financial Forecast
- Revenue Growth Rate: Projected to grow at 10% per year
- EBITDA Margin: Expected to improve from 15%
- Capital Expenditures: 3% of revenue per year
- Depreciation and Amortization: 3% of revenue per year
- Working Capital Needs: 1% of revenue per year
- Debt Schedule:
- The debt schedule is most critical part of the LBO Modeling Test.
- Term Loan: The only factor that impacts the ending TLB balance is the scheduled principal amortization of 5%. For each year, this will be calculated as the total amount raised (i.e., the principal) multiplied by the 5% mandatory amortization

Step 4. LBO Exit Returns Schedule (IRR and MOIC)
1. Exit Valuation
The realization of the investment by the financial sponsor
- Exit Enterprise Value (TEV) = Exit Year EBITDA × Exit Multiple
- Conservative assumption: Exit multiple = Purchase multiple
- Exit Enterprise Value (TEV) = $ 883.2 millions
- Equity Value (Exit)= Exit Enterprise Value – Ending Year Net Debt
- Equity Value = $ 722.6 millions
- Offer Price Per Share = Exit Equity Value / # of Outstanding Shares
- Offer Price Per Share = $37.22
- Max Initial Equity Investment by Sponsors = Exit Equity Value/(1+ Minimum Required Annual Return)^(End Period – Start Period)
- Max Initial Equity Investment by Sponsors = $ 290.4 millions
- Max Initial Transaction Value = Max Initial Equity Investment by Sponsors + Initial Debt Investment based on Leverage Ratio
- Max Initial Transaction Value = $580.4 millions
- Max offer Price Per Share = (Max Initial Transaction Value – Net Debt @ start)/# of Outstanding shares
- Max offer Price Per Share = $44.64

2. LBO Return Metrics: Internal Rate of Return (IRR) and Multiple on Invested Capital (MOIC)
- IRR – The Internal Rate of Return (IRR) is the annualized interest rate at which the initial capital investment must have grown to reach the ending value from the beginning value.
- Internal Rate of Return (IRR) = (Ending Value ÷ Current Value) ^(1 ÷ Number of Periods) – 1
- Internal Rate of Return (IRR) = MOIC ^ (1 ÷ t) – 1
- IRR = 26.8 %
- MOIC stands for “Multiple on Invested Capital” and measures investment returns by comparing the value of an investment on the exit date to the initial equity contribution.
- The MOIC is metric is used to track the performance of an LBO investment and to perform a comparative analysis of a fund’s returns.
- Multiple on Invested Capital (MOIC) = Total Cash Inflows ÷ Total Cash Outflows
- Multiple on Invested Capital (MOIC) = Exit Equity Value ÷ Initial Sponsor Equity
- MOIC = 3.4x

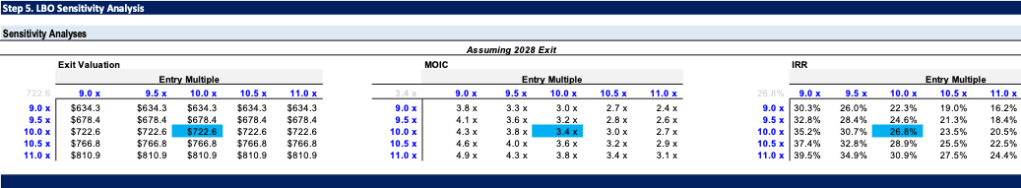
Step 5: Sensitivity Analysis
In this step, different operating cases must be considered—e.g. a “Base Case”, “Upside Case”, and a “Downside Case”—along with sensitivity analysis to assess how adjusting certain assumptions impacts the implied returns from the LBO model.
- Base Case: The outcome with the highest probability of occurrence.
- Upside Case: The most optimistic outcome, where performance far exceeds expectations.
- Downside Case: The most pessimistic outcome, where performance fails to meet expectations.
- Scenarios: 1
- Base Case: Entry multiple 10.0x, Exit multiple at 10x
- Best Case: Entry multiple 9.0x, Exit multiple at 11x
- Worst Case: Entry multiple 11.0x, Exit multiple at 9.x
- Impact on Equity Value and IRR:
- Base Case: Equity Value $722.6 million, MOIC 3.4x and IRR 28.6 %
- Best Case: Equity Value $810.9 million, MOIC 4.9x and IRR 39.5 %
- Worst Case: Equity Value $634.5 million, MOIC 2.4x and IRR 16.2 %
- Scenarios:2
- Base Case: Exit multiple at 10x, leveraged Ratio 6.0x
- Best Case: Exit multiple at 9.0x, leveraged Ratio 6.5x
- Worst Case: Exit multiple at 11x, leveraged Ratio 5.5x
- Impact on Equity Value and IRR:
- Base Case: Equity Value $722.6 million, MOIC 3.4x and IRR 28.6 %
- Best Case: Equity Value $753.5 million, MOIC 4.9x and IRR 38.7 %
- Worst Case: Equity Value $691.7 million, MOIC 2.6x and IRR 19.4 %

Step 6: Model Validation and Output
The LBO model validation process ensured the accuracy and reliability of inputs, assumptions, and calculations. The output analysis demonstrated a robust financial performance, healthy leverage ratios, and attractive returns, confirming the feasibility and profitability of the leveraged buyout. This comprehensive validation and output analysis framework can serve as a reliable guide for making informed investment decisions in LBO transactions.
Conclusion
The LBO by the private equity firm will be able to fetch a 3.0x MOIC on its initial equity investment in AlphaCore Technologies Inc and achieve an IRR of 23.1% through the holding period of 5 years. By optimizing capital structure and implementing cost-saving measures, the firm can achieve significant value creation, resulting in a favorable IRR and substantial returns on investment.
- Initial Equity Investment: $214.7 MM
- Enterprise Value at Exit: Based on a 10x EBITDA multiple, the enterprise value at exit in Year 5 is estimated at $883.2 million.
- Equity Value at Exit: After accounting for remaining debt, the equity value at exit is projected to be $722.6 million.
- Max Share offer Price = $ 44.64
- Internal Rate of Return (IRR) = 26.8%
- Multiple on Invested Capital (MOIC) = 3.4x
By utilizing a mix of equity and debt, the buyers were able to finance the acquisition and implement strategic changes that enhanced the company’s value.
